Life as a maintenance person can be very difficult at times. They are presented with mysteries on a daily bases. One of my favorites is when there is a temporary PROFIBUS issue – you are called down to the machine but by the time you get there, everything is working again! All the operator can say is that the machine stopped and then after a few minutes we were able to start it again. You look at the PLC fault table and it says there was a channel error and then gives you a long string of hexadecimal numbers. You have ProfiTrace so you can look at the network, but it is working again. Sometimes ProfiTrace will show an issue that you can fix so the machine does not go down again. However, quite often, you have to wait until it happens again. Set up ProfiTrace to monitor the network and wait for the fault to happen.
Now, let’s look at this story again, but with a COMBRICK monitor at the beginning of the network and ProfiHubs throughout the network to join the different segments together. Now, when the same issue occurs, you can go to the COMBRICK and see a history of what has happened on the network.
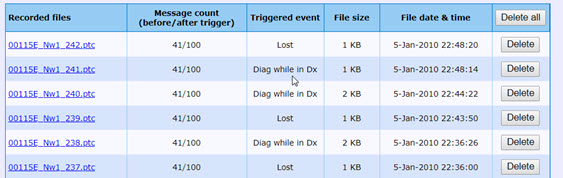
History of what has happened on your network!
After loading the GSD files into the COMBRICK, it will even decode in English any diagnostic messages.
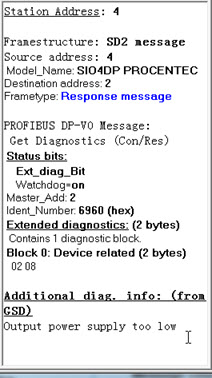
Diagnostic messages decoded in English
When using a bus monitor, any physical layer issue on the far side of a repeater is invisible to you. However, the COMBRICKs talks with the ProfiHubs and get important physical layer information.
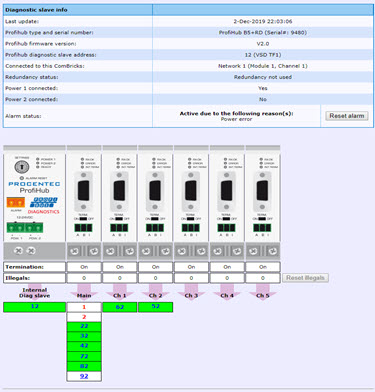
Information from downstream segments
Thus you would be able to see key information even if your network consisted of many segments.
I find this a very powerful combination. The more I use constant monitoring, the more I love it.
By the way, if you have PROFINET or Ethernet/IP, then you can get constant monitoring by using Atlas. See this paper for more information.